1/28/2004 slide 10

Information Graphics
•Rene Descartes early 1600s): x- and y-axes, Cartesian coordinates, repeated axes= Cartesian grid
•William Playfair(1759-1823): invented line chart, bar chart, and pie chart
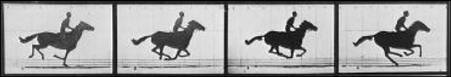
•Edward Muybridge—scientific photography (horse pictures 1877-78)
•Tufte: The Visual
Display of Quantitative Information, 1983 (2nd edition 2001)