Metaphorical Form Design
CS237 Assignment #5
1. Dates
|
Out |
Thurs, 10/3 |
|
Due |
Tues, 10/8 |
2. Goals
- Gain an understanding of categories and breadth of graphic form.
- Exploration of complex combinations of graphic qualities.
- Explore connections between graphic qualities and implied content.
- Connect changes in graphic character with changes in datasets over time, creating a visualization of data narrative.
- Work with multiple icons in an info-composition, contrasting formal transformations of the assembled icons for ease of legibility and clarity of data relationships.
3. Readings
Benjamin Martinez and Jacqueline Block, Perception Design And Practice
Intro.; Chap. 2 Simplicity; Chap. 3 Shape; Chap. 4 Dynamism (pp. 1-46)
Figure and Ground and depth: pp. 47-64
Paul Klee, The Thinking Eye: Notebooks pp. 1-67, 105-119,
and 123-131.
4. Assignment
Part One: Interaction of Graphic Transformation
Each of the following groups of shapes represents a sequence. Assign a meaning to each step of the sequence—that is: determine a meaning for each shape and describe how that meaning changes from one state to another in the sequence. Your transformations should involve physical principles: weight, density, speed, size, direction, or states of being: liquidity, amorphism, crystallization, volatility, compression etc. Be as specific and imaginative as possible (multiple values may be expressed by and icon of a transformation), but be prepared to explain your thinking clearly. Ideally, your interpretation should be easily understood and ultimately adopted by another viewer. The goal is to construct a narrative of symbolic physical change which “reads” smoothly based on the changing visual character of the icons
1.
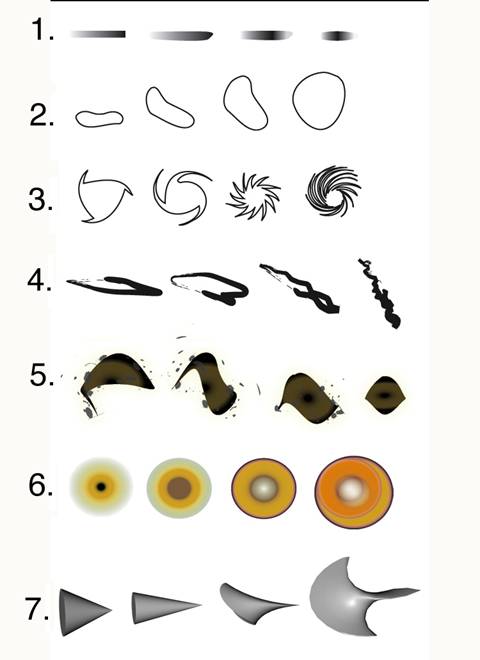
Hand in, by e-mail, a written characterization of your interpretation of the transformations suggested by each group of four icons in the handout. Your interpretation should be as imaginative as possible, but based on honest reaction, and defensible in relation to the visual character of the icon group. The qualities that are under transformation need not be related to arterial flow, but should be physical qualities of form, movement, growth, temperature, etc.
Part Two: Info-compositions
Design an “info-composition” involving four states of transformation within a narrative of arterial flow in the vicinity of a side branch. Each composition should include icons/geons* for the following values: (*geons are 3D icons)
1. flow speed
2. flow direction
3. pressure
4. vorticity
5. wall pressure
6. wall dwell/residence time
You may combine multiple values in one icon, using different visual variables to suggest different data values, as in assignment #3. In this case, however, we are seeking to strengthen the intuitive clarity of the connection between visual variable and data value. There should be a level on which a viewer can make an immediate connection between the visual transformation of your icons, and the changes in the fluid forces they represent. In other words, if a “typical” viewer were to interpret you design, as in the first part of this assignment, we would hope that they would come up with something close to the specific values you are seeking to represent with each icon you design. Obviously it is necessary for you to have a basic understanding of the character of the six data values listed above in order to represent them effectively. If you are confused about what residence time or vorticity might look like, ask via e-mail. However, the mode of representation here is metaphorical, not literal. The goal is to make a design evoke or feel like a given data value, not necessarily show what it actually looks like. A smoothed out horizontal form may suggest speed, for example, but it is not literally moving, and you would have to decide how greater or lesser velocity would change the visual form of the icon.
Your composition may be more or less graphical or three-D, but it should show the narrative occurring in situ, with basic reference to the space of the arterial interior. The artery wall should be shown as an integrated surface, composed of icons (connected or disconnected to each other) that elucidate the forces playing upon the surface. The blood flow may be visualized as streamlines, or as series of icons representing various values. If streamlines are used, they should be in iconic form, with variables that can be clearly understood by the viewer.
Any 2D (icon) or 3D (geon) form can be used, (as can color and texture).
5. Resources
You may find inspiration for you icon designs from some of the natural forms we looked at in the first day of class. These are available on the main class web page under “Inside the Body”.
6. Questions
- Give an example of a literal connection between a graphic transformation and a data variable. Give an example of a metaphorical connection. Give an example of a coded or arbitrary connection. Are there pros and cons to these three approaches?
- Are there qualities of graphic form that might be better suited to the VR environment of the Cave? Is there an advantage to 2D visualization or 3D?
- Are there categories of formal transformation that are complimentary: that is, which can exist side by side with discrete legibility?
- Are there principles of design that can be referred to in assuring an intuitive or natural legibility of graphic metaphor?
7. Checklist
o Created written characterization of the icon groups shown in Part 1.
o Created 1 info-composition as described in part 2.
o Answered assignment questions.
o Consider how these principles might function in 3D – look ahead to the next assignment.
o Plan to be at the Cinema 4D workshop for the next assignment if you don’t already know how to use it.